|
Cost of Electricity & Air Emissions from Systems Part 1:
Reducing Greenhouse Gas Emissions
by William G. Acker
Share This Article

Reducing Greenhouse Gas Emissions and the Impact on U.S. Energy Prices. The international effort to halt global warming may send energy prices soaring.
Over the past 12 months,
crude-oil prices have surged
to the highest level since
the Persian Gulf War,
proving once again that we have very
little control over a critical cornerstone
of our economy: energy prices.
The oil embargo of 1973 led to long
lines at service stations, higher overall
energy prices, double-digit inflation,
and a general sense of panic. It's important
to remember that the latest shortage,
which tripled the price of a barrel
of oil, occurred because OPEC cut oil
production by only about 5 percent of
world demand.
 |
Articles
|
The current international effort to
reduce greenhouse-gas emissions from
the burning of carbon fuels is going to
have a significant impact on the price of
energy in the U.S. and on our economy.
In 1998, the Energy Information Administration
(EIA) of the Dept. of Energy
released a study titled "Impacts of
the Kyoto Protocol on U.S. Energy Markets
and Economic Activity." The report
details five different scenarios, the
worse of which has coal prices increasing
by over 800 percent in 10 years compared
to a "reference case" which assumes
no changes in U.S. policy, law, or
taxation regarding the coal industry.
The EIA's worse-case scenario assumes
that two significant policy changes will
occur in the U.S. in next 10 years: Senate
ratification of the Kyoto Protocol, an
international agreement to reduce
greenhouse-gas emissions, as well as the
passage of a carbon tax, which is a fee designed
to strongly discourage the use of
fuels that produce CO2. The best-case
scenario in the same study has coal
prices increasing 152 percent by 2010.
If the Kyoto Protocol is ratified, the
EIA maintains that the U.S. could reduce greenhouse-gas emissions in other
ways, besides slashing coal use: for example,
international carbon trading
with other countries; developing
higher efficiency motors, as well as hybrid
motors, which consume less fuel;
and planting more trees.
While the EIA likes to discuss these
alternate means of cutting greenhouse
emissions, an analysis of U.S. fuel consumption
trends reveals that it would be
virtually impossible to achieve the reductions
set forth by Kyoto without penalizing
coal use.
The intent of this article is to provide
the reader with some insight into
future prices of coal, petroleum, natural
gas, and electricity through 2020, with
a focus on the possible outcome on fuel
prices resulting from a concentrated effort
to slash our carbon emissions.
Since energy is used to produce most
goods and services in this country,
higher energy prices are a major concern
to everyone. Decisions your company
makes today should reflect the reality
that energy prices are poised to
change dramatically due to the restructuring
of the U.S. electric-power industry
and the worldwide commitment to
reduce greenhouse-gas emissions. The
fact that coal prices may increase
somewhere in the range of 150 to 800
percent in the next decade should be a
consideration if your plant or facility,
for example, plans to install a new
coal-fired boiler in the near future.
Of course, reducing our use of coal
will increase our dependency on other
energy sources. What follows in this article
(Part 1 of a 2-part series) is an
analysis of our energy sources and what
the impact of both electric utility restructuring
and the Kyoto Protocol will
be on each of them.

U.S. Electric Power Industry The electric-power industry in the
United States is composed of traditional
electric utilities as well as power
marketers and non-utility power producers.
Currently, the industry is being
restructured so that the three primary
components of electric service—generation,
transmission, and distribution—
are separated. Instead of purchasing
power from the local utility,
consumers will be able to purchase
from other generators across the U.S.
Proposed legislation will deregulate the
generation part of the industry; however,
transmission and distribution
utilities will continue to be controlled
by state regulatory commissions. This
section of the article will review the
costs that makeup the total delivered
cost of electricity (Busbar cost) for
each generation system technology.
The author chose to review total costs
so that the data could be compared to
data from the EIA (1998 Electric
Power Annual, Vol. 1; 1997 Electric
Power Annual, Vol. 2; Financial
Statistics of Major U.S. Investorowned
Electric Utilities, 1996; Electric
Sales and Revenue, 1997; Emissions of
Greenhouse Gases in the U.S., 1998;
and Annual Energy Outlook 2000).
The electric-power industry in the
United States is composed of traditional
electric utilities as well as power
marketers and non-utility power producers.
Currently, the industry is being
restructured so that the three primary
components of electric service—generation,
transmission, and distribution—
are separated. Instead of purchasing
power from the local utility,
consumers will be able to purchase
from other generators across the U.S.
Proposed legislation will deregulate the
generation part of the industry; however,
transmission and distribution
utilities will continue to be controlled
by state regulatory commissions. This
section of the article will review the
costs that makeup the total delivered
cost of electricity (Busbar cost) for
each generation system technology.
The author chose to review total costs
so that the data could be compared to
data from the EIA (1998 Electric
Power Annual, Vol. 1; 1997 Electric
Power Annual, Vol. 2; Financial
Statistics of Major U.S. Investorowned
Electric Utilities, 1996; Electric
Sales and Revenue, 1997; Emissions of
Greenhouse Gases in the U.S., 1998;
and Annual Energy Outlook 2000).
Table 1 provides the electric utility
costs to produce, transmit and distribute
electricity to the customer with
existing generation systems. The primary
source of financial data in this
table comes from Federal Energy Regulatory
Commission (FERC) Form 1
manuals of low-cost utility providers.
The data were then compared to government
publications which summarize
the data taken from the utilities
FERC Form 1. The total Busbar cost or
revenue per KWH from these existing
systems tend to be lower because they
are older systems with low depreciation
and low long-term debt.

 The average age of coal-fired systems
in the U.S. is approximately 41 years,
hydro is 54 years, oil steam is 31 years,
natural gas is 30 years and nuclear is 18
years. The gas-turbine system represented
in Table 1 would be a fairly young
plant. The prices are 1997 costs per KWH.
The low-cost producer in this table is hydroelectric
at 4.72 cents per KWH followed
by coal steam at 5.72 cents per
KWH. Due to limited resources, hydroelectric
power is not the predominant
technology in the U.S. It is coal steam,
which produces over 55 percent of our
electricity. Due to upcoming environmental
pressures, coal usage will decrease
over the next 20 years. The degree
to which it decreases is subject to
debate. According to the EIA's Annual
Energy Outlook, coal usage will continue
to increase, but lose market share
over the next two decades.
The average age of coal-fired systems
in the U.S. is approximately 41 years,
hydro is 54 years, oil steam is 31 years,
natural gas is 30 years and nuclear is 18
years. The gas-turbine system represented
in Table 1 would be a fairly young
plant. The prices are 1997 costs per KWH.
The low-cost producer in this table is hydroelectric
at 4.72 cents per KWH followed
by coal steam at 5.72 cents per
KWH. Due to limited resources, hydroelectric
power is not the predominant
technology in the U.S. It is coal steam,
which produces over 55 percent of our
electricity. Due to upcoming environmental
pressures, coal usage will decrease
over the next 20 years. The degree
to which it decreases is subject to
debate. According to the EIA's Annual
Energy Outlook, coal usage will continue
to increase, but lose market share
over the next two decades.
Table 2 is information taken from
the EIA's "Electric Power Annual."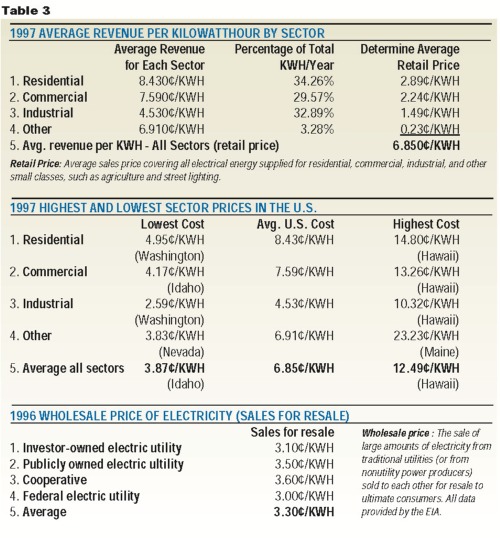 The average revenue in cents per KWH is
calculated by dividing the total revenue
by the corresponding KWH sales for each
sector (residential, commercial, industrial,
and other) and from all generation
technologies in that state. To compare
the Busbar cost of each technology, it
was important to look at states that had
high percentages of electricity generation
for that technology. The numbers
in the two tables seem to compare
rather favorably to Table 1 data except
for nuclear. After further review the author
did find somewhat high costs from
sales for resale that could be adding as
much as a cent per KWH. According to
data from the Nuclear Energy Institute
(NEI) on operations, maintenance and
fuel, there is a 1.6 cent/KWH variation
from low -cost plants to high-cost
plants. At this point, it is difficult to say
exactly how much of the added cost (2.8
to 3.50 cents per KWH) is from nuclear
plants and how much might be from
other technologies, sales for resale, and
outside contracts.
The average revenue in cents per KWH is
calculated by dividing the total revenue
by the corresponding KWH sales for each
sector (residential, commercial, industrial,
and other) and from all generation
technologies in that state. To compare
the Busbar cost of each technology, it
was important to look at states that had
high percentages of electricity generation
for that technology. The numbers
in the two tables seem to compare
rather favorably to Table 1 data except
for nuclear. After further review the author
did find somewhat high costs from
sales for resale that could be adding as
much as a cent per KWH. According to
data from the Nuclear Energy Institute
(NEI) on operations, maintenance and
fuel, there is a 1.6 cent/KWH variation
from low -cost plants to high-cost
plants. At this point, it is difficult to say
exactly how much of the added cost (2.8
to 3.50 cents per KWH) is from nuclear
plants and how much might be from
other technologies, sales for resale, and
outside contracts.
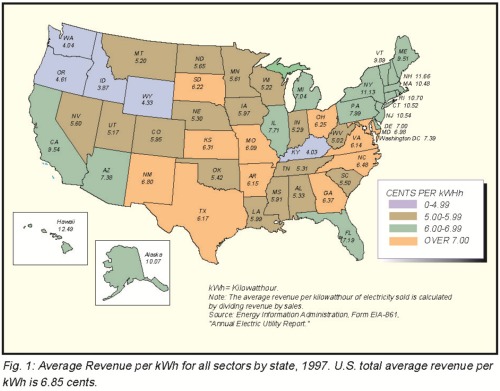
Figure 1 is a map of the U.S., which illustrates
the average revenue per KWH in
all sectors by state for 1997 (also called
retail price). These data were taken from
EIA Form EIA861 "Annual Electric
Utility Report". Table 3 provides a
breakdown of the average retail price
into an average price for residential,
commercial, industrial and other. This
table also provides the average 1996
price from each type of electric utility.

Many existing utility generation systems
in the United States are fairly old
and their construction costs already
have been recovered. For this reason, it
is important to look at the total revenue
costs for new capacity as well.
Table 4 illustrates the total revenue
operating costs for new electric utility
generating systems. For new capacity additions, the low capital cost and high
operating efficiencies of natural-gas,
combined-cycle gas turbine plants are
the most economical. The total revenue
(or operating costs) will be higher
in new capacity additions verses existing
capacity because of the capital recovery
costs. You will note that the
older, depreciated coal-steam generation
systems produce electricity at 5.62
cents per KWH (Table 1) versus a newly
installed natural gas combined cycle
turbine at 5.72 cents per KWH (Table
4). Therefore, a low-cost utility would
want to keep its older coal units running.
However, as electric demand increases,
requiring new construction,
the preferred system is a natural gas
combined cycle turbine.

Hydroelectric systems were not included
in Table 4 because, under current
circumstances, hydroelectric generating
capacity is expected to remain
virtually unchanged due to water use
priorities moving away from electricity
generation and toward environmental
improvement, such as fish, habitat
preservation, and recreation (EIA's
Annual Energy Outlook 2000).
Information from the EIA on utility
capacity additions also supports naturalgas
turbines as the choice system. From
1996 to 2010, combined-cycle gas-turbine
system installations are expected to
grow from 15,200 to 90,100 MW, a 493-
percent increase. Coal- steam systems,
however, will only increase from 303,700
MW to 307,800 MW, a 1.35 percent increase
(assuming no Kyoto Protocol).
Coal system electric generators will increase
their electricity output approximately
18 percent from existing systems
by increasing their average utilization
rate. Although, coal maintains its fuel
cost advantage over both oil and natural
gas, gas-fired generation is the most economical
choice for construction of new
power-generation units when capital,
operating and fuel costs are considered.
Another reason for the slow-down in
coal-fired installations may be the upcoming
environmental pressures. The
biggest challenge for coal fired utilities is
facing the regulatory uncertainty.
The impact of future compliance
costs to handle particulate, SO2, SO3,
lead, mercury, and arsenic eventually
will result in higher electricity costs from
coal-steam systems. The total operating
maintenance and capital recovery cost
of a flue gas desulfurization system is
around 0.5 cents per KWH. Each existing
coal-fired plant must weigh the impact
of compliance cost on the projected cost
of electricity in their region. The flue gas
emission discharge for each generation
technology in Table 5 illustrates the significantly
higher rates from coal steam
generation systems.
Coal-fired electric utilities in the U.S.
have made a lot of improvements over
the last 10 years to clean their flue gas
emissions, however, current environmental
pressures will require further improvements
which will result in higher
operating costs. If you compare coalfired
systems to conventional naturalgas
combined-cycle turbines (Table 5),
the lbs of CO2 per KWH from the coal system
is around 159-percent higher. If you
compare lbs of SO2 per KWH, the coal system
without an SO2 scrubber is approximately
240,000 times higher. With a
scrubber, it is 3300 times higher. Currently,
there are 1207 coal-fired generation
systems in the U.S. and only 193 systems
(19 percent) have SO2 scrubbers.
In summary, as individual states restructure
their electricity markets, increasing
numbers of customers will have
the opportunity to chose their electricity
suppliers resulting in lower electricity
prices for most. The 1998 plan issued by
the Clinton Administration said that
consumers would save $20 billion per
year under deregulation (0.55cents per
KWH), which apparently would save the
U.S. around 8 percent on the average retail
price of electricity. According to the
Annual Energy Outlook 2000, the average
price of electricity will decline (assuming
no Kyoto Protocol) from 6.7
cents per KWH in 1998 to 6.1 cents per
KWH in 2005, to 6 cents per KWH in 2010,
to 5.9 cents per KWH in 2015, and finally
to 5.8 cents per KWH in 2020. This represents
an average annual decline of 0.6
percent. According to the "Impacts of the
Kyoto Protocol on U.S. Energy Markets
and Economic Activity" report, this
translates into decreases for residential,
commercial, and industrial electricity
users of 10 percent, 17 percent and 14
percent, respectively, from 1998 to 2020.
Some states, however, are expected to experience
a price increase, such as Idaho,
which currently has low cost hydroelectric
power. In March 1999, the Agriculture
Dept. issued a report that listed 19
states expected to have higher electricity
prices. The states are in the Pacific
Northwest, Mountain States, Mid-
South, Northern Plains and in some
Great Lakes states. In Figure 1, states that
are very low- cost producers of electricity
may see their rates increase because under
deregulation these low-cost utilities will
have the opportunity to sell their power
to more expensive states (or regions) and
thus increase their profit margins.
Impacts of the Kyoto Protocol
As currently written, the Kyoto Protocol
requires the U.S. to reduce its carbon
emissions to 7 percent below 1990 levels.
In 1990, the six greenhouse-gas
emissions in the United States totaled
5,489,900,000 tons of gas. When each
gas is weighted by its global warming
potential, the total is 1,642,000,000
metric tons of carbon or carbon equivalent.
Of this total, the combustion of
energy fuels produced 5,440,267,390
tons of CO2 gas or 1,346,000,000 metric
tons of carbon which is 82 percent
of the total emissions. By 1998, the energy
related emissions increased to
6,003,290,605 tons of CO2 or
1,485,400,000 metric tons of carbon.
The greenhouse gases that absorb infrared
radiation (heat) are water vapor
(H2O), carbon dioxide (CO2) methane
(CH4), nitrous oxide (N2O), and a host
of engineered synthetic chemicals such
as Hydrofluorocarbons (HFCs), perfluorocarbons
(PFCs), and sulfur hexafluoride
(SF6). Water vapor is the most common
with an atmospheric concentration
of almost 1 percent, carbon dioxide is
0.0356 percent, methane is 0.00017 percent
and nitrous oxide is 0.000031 percent.
The greenhouse gases covered by
the Protocol are carbon dioxide,
methane, nitrous oxide, hydrofluorocarbons,
perfluorocarbons, and sulfur hexafluoride.
For the three synthetic greenhouse
gases, countries have the option of
using 1995 as the base year.
Basically, there are three ways that
the U.S. plans to reduce energy related
carbon emissions: cut the demand for
energy, use more efficient equipment,
or switch to less carbon-intensive fuels
(from coal to natural gas), or noncarbon
fuels.
Fossil fuels derive their energy content
primarily from oxidation of the
hydrogen and carbon in the fuels.
However, coal derives a higher percentage
of its energy content from the
oxidation of carbon than oil or natural
gas. This is illustrated in Table 5 under
CO2 (lbs per million BTU of fuel).
The CO2 formation from coal combustion
is around 76 percent higher than
natural gas and around 24 percent
higher than petroleum. As you can
see, the proposed Kyoto Protocol limitations
on carbon emissions will have
a significant impact on the coal industry,
the mining industry and the railroad
industry, all of which will trickle
down into dozens of other industries.
The impacts to fuel costs and the U.S.
economy from the international effort
to reduce greenhouse gas emissions
will be discussed in the second half of
this two-part series, which will appear
in the September, 2000 issue of HPAC
Engineering.
Cost of Electricity & Air Emissions from Systems Part 2:
Reducing Greenhouse Gas Emissions
by William G. Acker
The international effort to halt global
warming may send energy prices soaring
The Kyoto Protocol is the
name commonly used to describe
the agreement that
came from the "Third Session
of the Conference of the Parties to the
Framework Convention on Climate Change," which was held in Kyoto, Japan,
in December 1997. During that
meeting, representatives from more
than 160 countries met to negotiate
binding limits on greenhouse-gas emissions
for developed nations.
Change," which was held in Kyoto, Japan,
in December 1997. During that
meeting, representatives from more
than 160 countries met to negotiate
binding limits on greenhouse-gas emissions
for developed nations.
What Kyoto Demands
The Kyoto agreement established a
legally binding protocol under which
industrialized countries would reduce
their collective emissions of six greenhouse
gases—carbon dioxide, methane,
nitrous oxide, hydrofluorocarbons, perfluorocarbons,
and sulfur hexafluoride—
by 5.2 percent below their 1990
levels by the first commitment period,
which begins in 2008 and ends in 2012.
The target for the U.S. is 7 percent below
1990 levels. Because the Protocol
does not specify any targets beyond the
first commitment period, the target is
assumed to hold constant from 2013
through 2020. The participating developed
countries, or Annex I countries,
are the U.S., Eastern and Western Europe,
Russia, Ukraine, Japan, Australia,
New Zealand, and Canada. The 133
non-Annex I countries, which include
Mexico, India, China, and South Korea,
have no targets under the Protocol.
To become binding in the U.S. , the
Senate must approve the Protocol. So
far it has not been submitted to the Senate
for ratification.
To recap Part 1 of this series, there
are three ways that the U.S. can reduce
energy-related carbon emissions: cut the
demand for energy, use more efficient
equipment, and switch to less carbonintensive
fuels (from coal to natural gas)
or non-carbon fuels. Figure 1 shows the
usage of the three primary fuels (petroleum,
coal and natural gas) for both the
reference case, which assumes no Kyoto
Protocol, and the case of 7 percent below
1990 levels. By comparing the fuel
usages of the two cases, one can get a
sense of how the three ways to reduce
energy-related carbon emissions will
work.
In 1990, the six greenhouse-gas emissions
in the U.S. totaled 5,489,900,000
tons of gas. When each gas is weighed
by its global-warming potential, the total
is 1,642,000,000 metric tons of carbon
or carbon equivalent. Of this total,
the combustion of energy fuels produced
5,440,267,390 tons of CO2 gas or
1,346,000,000 metric tons of carbon,
which is 82 percent of the total emissions.
By 1998, energy-related emissions
increased to 6,003,290,605 tons of CO2
or 1,485,400,000 metric tons of carbon.
Figure 1 illustrates emissions from the
combustion of energy fuels from 1990
through 2020. There are two graphs
plotted on this chart: the reference case
graph and the 7-percent-below-1990
graph. The reference case graph represents
actual emissions from 1990
through 1998 and reference projections
from 1998 through 2020, assuming that
the Kyoto Protocol is not enforced. The
second graph, 7-percent-below-1990,
represents the projections of emissions
assuming the Protocol is approved by
the Senate and assuming that the target
of 7 percent below 1990 levels is met entirely
by reducing energy-related carbon
emissions with no offsets from sinks
(land use and forestry issues) and other
greenhouse gases or international activities.
This graph represents the worstcase
scenario in regard to the amount of
emissions reductions required to meet
the Kyoto Protocol goal and on the potential
impact on U.S. energy prices,
energy uses and the economy. The Energy
Information Administration's
(EIA's)analysis of the Kyoto Protocol
has five less stringent scenarios that may
or may not be the final goal of energyrelated
emissions.1 This article will only
focus on the reference case and the 7-
percent-below-1990 case.
Table 1 provides the CO2-emissions
numbers used in the graph as well as
the metric tons of carbon equivalent.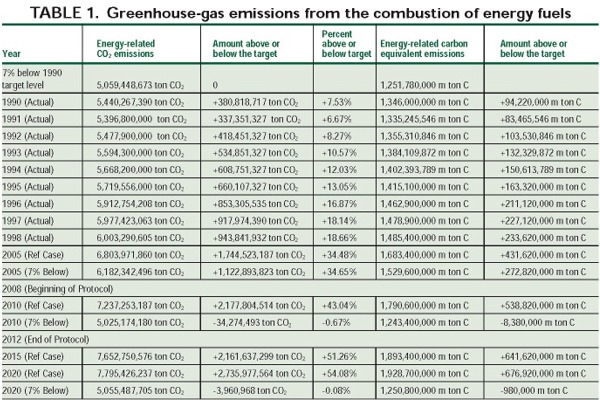 By 2010 (mid-year of the Kyoto commitment
period), the reference case
emissions are 43 percent above the 7-
percent-below 1990 emissions, which
is 2,177,804,514 tons of CO2 over the
target of 5,059,448,673 tons of CO2.
By 2010 (mid-year of the Kyoto commitment
period), the reference case
emissions are 43 percent above the 7-
percent-below 1990 emissions, which
is 2,177,804,514 tons of CO2 over the
target of 5,059,448,673 tons of CO2.
In the reference case, all fuels continue
to grow in demand but in the 7-
percent below 1990 case, petroleum and
coal usage drops and natural gas usage
increases. By 2020, coal consumption
drops dramatically to 71,000,000 tons
per year for the case of 7- percent-below-
1990, which is a 91-percent drop
from the usage in 2005. In comparison
to the reference case, coal consumption
is down by 94 percent. This major drop
in coal consumption is related to its
CO2 formation.
Figure 2 illustrates the changes in future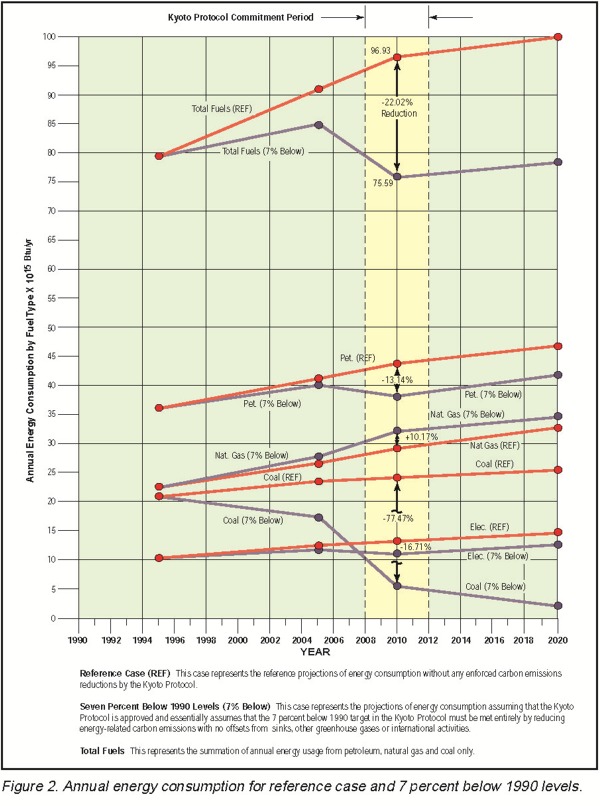 fuel consumption for the reference
case and the 7-percent-below-1990
level (on a Btu basis). One also can
compare the differences in fuel consumption
from the reference case to the
case of 7-percent-below-1990 level. For
coal, petroleum, and electricity, there is
a drop in consumption from the reference
case to 7-percent-below-1990 levels
of 77.47 percent, 13.47 percent and
16.71 percent, respectively. Natural gas,
however, increases by 10.17 percent.
Even though total natural-gas usage in
the U.S. increases only 10.17 percent,
electric generators will see a very significant
increase in their natural-gas usage
under this Kyoto Protocol goal. Their
natural-gas usage from 1996 to 2005 will
increase 133 percent (or 4.06
quadrillion Btu), while from 2005 to
2010, it will increase 78.31 percent (or
5.56 quadrillion Btu), and from 2010 to
2020, it will increase 13.11 percent (or
1.66 quadrillion Btu). The critical question
is whether natural-gas capacity can
be built in sufficient quantity, if interstate
natural-gas pipelines can be built
on time, and if natural gas imports from
Canada and Mexico can support this
much expansion.
fuel consumption for the reference
case and the 7-percent-below-1990
level (on a Btu basis). One also can
compare the differences in fuel consumption
from the reference case to the
case of 7-percent-below-1990 level. For
coal, petroleum, and electricity, there is
a drop in consumption from the reference
case to 7-percent-below-1990 levels
of 77.47 percent, 13.47 percent and
16.71 percent, respectively. Natural gas,
however, increases by 10.17 percent.
Even though total natural-gas usage in
the U.S. increases only 10.17 percent,
electric generators will see a very significant
increase in their natural-gas usage
under this Kyoto Protocol goal. Their
natural-gas usage from 1996 to 2005 will
increase 133 percent (or 4.06
quadrillion Btu), while from 2005 to
2010, it will increase 78.31 percent (or
5.56 quadrillion Btu), and from 2010 to
2020, it will increase 13.11 percent (or
1.66 quadrillion Btu). The critical question
is whether natural-gas capacity can
be built in sufficient quantity, if interstate
natural-gas pipelines can be built
on time, and if natural gas imports from
Canada and Mexico can support this
much expansion.
Table 2 provides fuel-usage and CO2
emissions data for each of the fuel types
and CO2-emissions reductions from the
reference case and the case of 7-percent
below-1990 levels. To meet the 7- percent-
below-1990 goal, U.S. energy consumption would have to drop 19.51
quadrillion Btu in 2010—a 17.55-
percent reduction. Electric generators
created 9.96 quadrillion Btu per year of
the energy savings and remaining fuel
consumers created the other 9.55
quadrillion Btu per year. The reductions
in carbon emissions from electric generators
account for 68-percent of the total
CO2 emissions reduction, while the
remaining fuel consumers (residential,
commercial, industrial, and other)
account for 32 percent. The electric
generators accomplished the CO2 reductions through electricity-usage
reductions, generation efficiency, and
fuel switching.
reductions through electricity-usage
reductions, generation efficiency, and
fuel switching.
Kyoto Protocol Impact
Projected fuel and electricity prices in
the U. S. can be found in Table 3. The
data was taken from the EIA's Kyoto
Protocol study. Prices provided are actual
1996 prices, while projected prices
are for 2005, 2010, and 2020. All prices
are in 1996 dollars and costs (no escalation).
By providing the prices in 1996
dollars, one can see price variations that
occur without escalation variations.
Energy prices in the reference case
are fairly stable over the next 20 years.
Motor gasoline, distillate oil, and residual
oil show moderate price increases
through the year 2020. The Annual
Energy Outlook 2000 (AEO 2000)
prepared by the EIA illustrates slightly
higher prices than Table 3.
Coal prices are declining due to
gains in coal-mine labor productivity
and lower transportation costs. Natural-
gas prices are fairly stable over this
period, with most sectors experiencing
a slow increase in prices. Electricity
prices are dropping due to increased
competition, higher generating efficiencies,
and lower prices. The carbon
reduction target of 7-percent-below-
1990 reflects a "carbon price," which is
a tax that is applied to the cost of energy
intended to make carbon-rich fuels
financially untenable. In its report,
the EIA included projections based on
this tax at the request of Congress. The
carbon price that is applied to each of
the energy fuels is related to its carbon
content. With the carbon price included
in this delivered cost of energy,
energy prices are expected to rise significantly
above the reference-case
projections. Because of the higher carbon
content of coal and petroleum
products, the use of both fuels are reduced
and there is a greater reliance on
natural gas, renewable energy and nuclear
power. Coal is the most carbon
intensive of all the fossil fuels, therefore the delivered coal prices are most
affected by the carbon prices. As a result
of the carbon price, aggregate energy
prices in the U.S. will change significantly.
Table 3 provides energy-price projections
for the carbon-emissions-reduction
case of 7 percent below 1990
levels. It reveals that fuel prices increase
significantly, especially in 2010.
Coal prices are 867 percent higher
than the reference case , which is why
coal consumption drops by 80 percent
in that year (Figure 1). These changes
will have a significant negative impact
on coal industry, the railroads and
manufacturing that relies on coal. Regionally,
the price impact will be the
greatest in regions in which electricity
generation is currently dominated by
coal-fired power plants. Electricity
prices also increase significantly due to
higher fuel prices and capital investing
to replace coal-fired plants.
It is important to keep in mind that
the case of 7 percent below 1990 level
is the worst-case scenario (with respect
to fuel prices and emissions reductions),
which assumes that the
U.S. does not get any carbon-emission
credits for land-use forestry and agriculture,
existing programs to reduce
emissions of the other five greenhouse
gases, or for International Trade of
Carbon Permits. The Impact of the
Kyoto Protocol document prepared by
the EIA includes five less severe cases
(3 percent below 1990 levels, equal to
1990, 9 percent above 1990, 14 percent
above 1990, and 24 percent
above 1990). The energy prices in
each of these scenarios are less than
the figures in Table 3, but price increases
are still significant, even in
the most generous scenario: 24 percent
above 1990 levels. For example,
in the year 2010 under that scenario,
coal prices will have increased 156
percent above the reference case
while industrial natural gas will have
increased 33 percent and electricity
will have increased 24 percent.


Each case implicitly assumed different
levels of reductions for forestry and agriculture
sinks, reductions from five other
greenhouse gases, the international trading
of emissions permits, and other international
activities, which may offset the
required reductions of energy-related
carbon emissions.
U.S. Fuel Imports
When the oil embargo hit in 1973,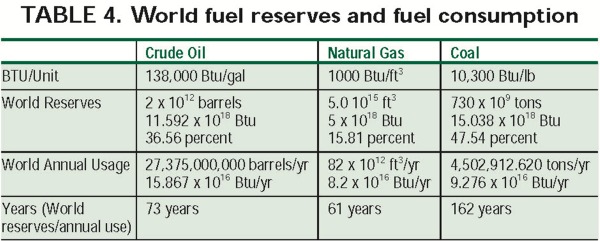 almost 17 percent of the U.S.'s electricity
was generated by burning more
than 560,000,000 barrels of oil per
year. Today's utilities are less reliant
on oil. Only 3.8 percent of our electricity
is produced by burning
197,000,000 barrels per year. The
transportation sector, however, continues
to rely heavily on petroleum fuels.
In 1973, oil consumption was at
3,285,000,000 barrels per year; today,
it is more than 4,600,000,000 barrels
per year. The transportation sector accounts
for 66.7 percent of U.S. petroleum
consumption.
almost 17 percent of the U.S.'s electricity
was generated by burning more
than 560,000,000 barrels of oil per
year. Today's utilities are less reliant
on oil. Only 3.8 percent of our electricity
is produced by burning
197,000,000 barrels per year. The
transportation sector, however, continues
to rely heavily on petroleum fuels.
In 1973, oil consumption was at
3,285,000,000 barrels per year; today,
it is more than 4,600,000,000 barrels
per year. The transportation sector accounts
for 66.7 percent of U.S. petroleum
consumption.
Over the next two decades, imports
of natural gas and petroleum will continue
to rise. Under the reference case,
natural-gas imports will increase from
12 percent in 1996 to 17 percent in
2005 to 17 percent in 2010 and to 16
percent in 2020.2 Petroleum imports
will grow from 46 percent in 1996 to 60
percent in 2005 to 62 percent in 2010
and 64 percent in 2020.
During the 1970s, the decade of energy
crisis, OPEC members produced
about 50 percent of the world's daily
production and had control over petroleum
prices. Then in the 1980s,
OPEC production dropped to 33 percent
of the total world production.
However, in 2014 OPEC nations will
account for more than 50 percent of
total U.S. petroleum imports. By 2020,
OPEC once again will produce 50 percent
of the world's petroleum.
Nuclear Power
In 1998 nuclear power produced 674
billion killowatthours of electricity in
the U.S. Replacing that generation
with natural-gas combined-cycle gasturbine
generators will increase U.S.
CO2 emissions by 277 million tons per
year, which is 21 percent more CO2
emissions to remove in the year 2010.
Using coal-fired generation results in
633 million tons per year of CO2 emissions
or 48 percent more emissions to
be removed in 2010.
Because of disasters such as the Chernobyl
accident in 1986, nuclear power is
not a politically popular energy source.
However, eliminating nuclear power as
an energy source fuel will make the
goals of the Kyoto Protocol even more
difficult. If we allow our nuclear plants
to die off in the U.S., it will take 21-percent
additional natural gas to produce
the same amount of electricity. Using
coal-fired generation to replace nuclear
would result in a 30 percent increase in
coal consumption.
Nuclear plants produce electricity
without emitting greenhouse gases. Nuclear
power could also reduce our dependence
on imported energy. Two
countries that seem to support nuclear
power are China and Russia. China
plans to increase its nuclear generation
from 1.1 percent of its total to 18 percent
by 2020. Russia plans to more than
double its current 14 percent to 31 percent
by 2030.
World Fuel Resources
Table 4 is the author's attempt to
look at the world resources of our three
primary fuels and their usages. It is important
to note that coal constitutes almost
48 percent of the world fossil fuel
reserves. Also, at the current rate of petroleum
usage, some analysts think that
demand will begin to exceed supply in
25 years.
Conclusion
The Greenhouse effect, caused by
rising rates of CO2 and other gases, still
is debated by the experts. One central
concern is what fraction of the increase
in atmospheric CO2 levels is attributable
to humans and what fraction
is attributable to natural sources. Another
concern is the lack of conclusive
correlation between human-made
emissions and global warming. It's
likely that the U.S. Senate may have to
vote on the Kyoto Protocol before the
experts reach more conclusive results.
The primary aim of this article was
to raise the level of understanding of
energy, technology, the environment,
resource availability, and the economy.
The intent was to provide the reader
with an appreciation of all these issues
so that we as a society can make equitable
decisions in the years ahead. The
author's advice to designers, installers
and maintenance people is to stay informed
on the issues of environmental
legislation in particular the Kyoto Protocol,
and to choose more efficient
equipment, which not only saves on
annual fuel costs, but also reduces our
air emissions and our dependence on
imported energy. One easy way to do
this would be to consider renewable
energy systems or to purchase electricity
made from renewable energy
sources. There is no single answer to
the questions about energy in the years
ahead, but you can be sure that there
will be environmental challenges and
probably be energy crises as well.
[ back to top ]
References
1. "Impacts of the Kyoto Protocol on
U.S. Energy Markets and Economic Activity."
Energy Information Administration,
1998.
2. "Annual Energy Outlook, 2000."
Energy Information Administration.
|
|
